Home » Posts filed under Operating Metrics
HCL Technologies Limited - Financial Performance 2006-2011

Financial Performance:
- 2009 revenue growth was affected due to global recession and Financial crisis and YoY growth was only 17%. YoY growth picked up again in 2010 ( 24%) and 2011 (31%)
- Reduced Operating expenses by almost half in 2009 (17% YoY) but again increased according to the revenue growth.
- Negative YoY growth in net profit in 2008 (-11%) and 2009 (-6%) but profitability significantly increased in 2011 (35% YoY)
HCL Technologies Limited - Geography Mix 2006-2011

Geography Analysis:
- Dependency on the US market is always high and the contribution reduced in 2011 compared 2010 but still 56% revenues come form the region. Peaked in 2010 with 62% of revenues.
- Europe is the second largest market but the contribution fell in 2010 but again increased in 2011 and historically HCL had strong presence in Europe.
- Rest of the world is also increasing compared to previous years and the company is looking to increase further.
HCL Technologies Limited Vertical Revenue Mix 2006-2011

Vertical Analysis:
- Manufacturing is the core vertical but the revenue contribution has been falling.
- Financial Services second largest vertical and growth is constant.
- Telecom is the third largest vertical but revenues have fallen significantly since 2009.
- Retail & CPG have fallen in 2007 and constant since. Healthcare revenues are constant in last two years.
- Energy Utilities and public sector have seen constant growth since 2009.
HCL Technologies Limited -Services Revenue Mix 2006-2011
Services Segment Analysis:
- Custom Application Services is the largest offering followed by Engineering R&D Services. Custom application services saw growth in 2011 and Engineering R&D services fell in 2011 compared to 2010.
- Enterprise Application services is growing constantly in the last three years between 21-24%.
- Infrastructure services are seeing significant growth from 15% in 2008 to 23% in 2011.
- BPO services revenue is falling since 2006 from 13% to 6% in 2011.
HCL Technologies Limited Contract Type 2006-2011
Time & Material contracts are the most preferred. But the Fixed price contracts are also seeing growth since 2008.
HCL Technologies Limited Onsite/Offshore Mix 2006-2011
Onsite has always been dominant contributor for HCL Tech but since 2009 the contribution significantly increased.
Source: Company Investors Site Website : www.hcltech.com/investors
Cognizant Technology Solutions Corp - Financial Performance 2006-2011
Financial Performance:
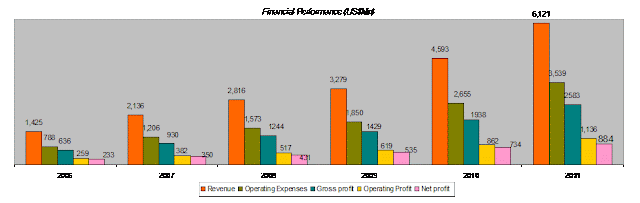
- Except in 2009 (16% YoY) due to recession caused by Global Financial Crisis Cognizant had seen significant YoY revenue growth 2010 (40%) and 2011 (33%). But compared to other Indian Top players Cognizant has done really well during and after the recession and crisis.
- Significantly reduced the operating expenses during FY 2009 and later increased operating expenses in line with the revenue growth.
- Cognizant has overtaken Wipro and became the Number 3 player and is closely following on the heels of number 2 player Infosys. Cognizant had seen tremendous growth in the past few years.
Cognizant Technology Solutions Corp - Geography Mix 2006-2011
Geography Analysis:
- Dependency on the North America is very high compared to other Indian Players and it gets almost 80% of revenues from the region.
- Europe has been constant at 18-19%.
- Rest of the World ( APAC, Latin America, MEA) revenues are small but growing slowly.
Cognizant Technology Solutions Corp - Vertical Revenue Mix 2006-2011
Vertical Analysis:
- Cognizant is the dominant player in the BFSI segment and it gets significant amount of revenues from Insurance segment along with financial services segment.
- Healthcare is the second largest revenue contributor and has significant dominance in this vertical and Healthcare spending in US is on the rise.
- Manufacturing/Retail/logistics is growing over past three years.
- Cognizant focuses on these few verticals for growth.
Source: Company Investors Site Website: http://investors.cognizant.com/
Wipro Limited Financial Performance 2006-2011

Financial Performance:
- Wipro saw revenue growth slowing down during 2009 (10% YoY) due to recession caused by 2008 Global Financial Crisis but revenue growth doubled in 2010 (20% YoY) which highlighted the fact that Wipro did well during 2010 compared to its peers.
- 2011 (17% YoY) is a different story as the company struggled with its Dual CEO structure and was forced to replace them by single CEO in January 2011 and there were other organizational changes too which affected its revenue growth. Its peers did tremendously well in 2011.
- Wipro reduced its operating expenses significantly in 2009 due to the cost cutting measures that the company adopted and since then there has been constant rise in expenses along with revenues. With significant organization and leadership changes the company is planning to recover its lost growth.
Wipro Limited Geography Mix 2006-2011

Geography Analysis:
- Dependency on the North American is constantly being reduced as evident in the above chart but still 55% revenues are from that region.
- Europe is the second largest market but the revenues have fallen since 2009 and constant at 26%-27% and the region is struggling to cope with Sovereign Debt crisis.
- India & Middle East market is growing significantly particularly in India it has won some big contracts from Government of India and other State governments.
- APAC and other markets are also seeing good growth and Japan is constant.
Wipro Limited Vertical Revenue Mix 2006-2011

Vertical Analysis:
- Like its peers Wipro is also dependent on BFSI vertical for majority of its revenues and it is one of the significant player.
- Manufacturing is the second largest and constant growing vertical. Retail & Transportation too has been constantly growing over the years.
- Wipro is a significant player in the Energy & Utilities vertical and has maintained constant revenues. Technology vertical revenues have been falling and Telecom vertical revenues are constant.
- Communication and Media and Healthcare Services have also seen good growth in the last few years.
Wipro Limited Services Revenue Mix 2006-2011
Services Segment Analysis:
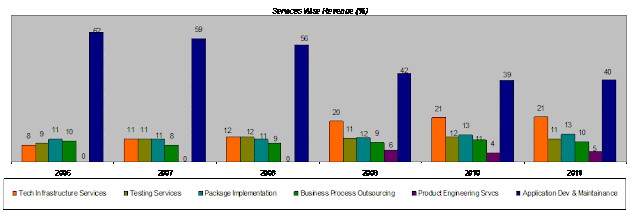
- Application Development & maintenance services is the largest service offering but dependency on the offering has reduced over years as Wipro was looking to increase revenues from other services.
- Revenues from Technology Infrastructure services saw significant growth and the company had invested significantly for increasing the revenues in this service offering.
- Testing services is constant revenue contributor. Package Implementation too constant revenue generator.
- Wipro also focused on constantly increasing the BPO revenues.
Wipro Limited Contract Type 2009-2011
Time & Material contracts are the most preferred. But the Fixed price contracts are also seeing growth since 2009.
Wipro Limited Onsite/Offshore Mix 2006-2011
Onsite has always been dominant contributor for Wipro. Except in 2009-2010 when clients to reduce cost favored offshore. In 2011 onsite saw growth.
Source: Company Investors site Website: www.wipro.com/investors


